After getting several feedback (yes, I do Voice of the Customers, LOL) and after looking at the current layout of this Blog, I believe now is a good 'rest point' and summarize what posts we have so far.
So here we go, I am going to list several popular entries, good to start from, based on several subjects:
Problem Solving:
Problemo Solved!
Simple Problem Solving
Creative Problem Solving
IDOAIM Problem Solving Series
Riddle Me This
Mindset:
The Luck Factor
Things You Cannot See
Important Quote
Stuck in the Past
Test Your Brain Response
Too Powerful to Worry
Entrepreneurship:
History of Jell-O
A Note from an Entrepreneur
As you see... Turns out that I am quite heavy on the Mindset subject. This is not intentional, but it shows my belief that solving problems creatively requires a fully checked mindsets. If you find yourself stuck: at work, at relationship, at business, or at anything, perhaps the answer is with the man in the mirror.
Cheers.

September 10, 2011


September 06, 2011

Problem Solving Series #5a - Analyze the Problem
Allright, now we have arrived at the most fun part of the IDOAIM problem solving steps: Analysis.
There are literally hundreds of ways to analyze your problem, but essentially here are key important features that you need to answer:
First of all, everything, I mean everything, has causes and effects. Your data collection, your site visits, and your analysis should discover what causes which effects. There are several simple tools to analyze numerical data and answer whether a particular variable affects a particular output:
a. Scatter plot : If you have a numeric variable that is continuous, i.e. you can have any real numbers that spans a particular range, preferably a very wide range, and if you have an output in question that is also continuous and spans wide, you may want to plot these pairs into a simple scatter plot and see if small value of the input has a small value of output. Here is an example:
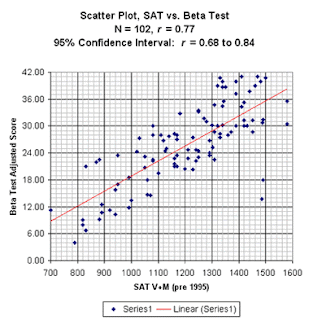 Courtesy of Jessica Hannah's Map Catalog - jessicahannahmaps.blogspot.com
In that scatter plot, whatever SAT is, it surely affects Beta Test score, whatever that is. So you don't really need to know what they are to know they are related. Nifty, right?
Don't go too fast!
It is still a good idea to understand the logic behind the relationship, because sometimes there is this thing called autocorrelation, which we shouldn't dwell too much here. (If you insist on an explanation, check this out, a simple illustration).
to be continued...
There are literally hundreds of ways to analyze your problem, but essentially here are key important features that you need to answer:
First of all, everything, I mean everything, has causes and effects. Your data collection, your site visits, and your analysis should discover what causes which effects. There are several simple tools to analyze numerical data and answer whether a particular variable affects a particular output:
a. Scatter plot
: If you have a numeric variable that is continuous, i.e. you can have any real numbers that spans a particular range, preferably a very wide range, and if you have an output in question that is also continuous and spans wide, you may want to plot these pairs into a simple scatter plot and see if small value of the input has a small value of output. Here is an example: 
In that scatter plot, whatever SAT is, it surely affects Beta Test score, whatever that is. So you don't really need to know what they are to know they are related. Nifty, right?
Don't go too fast!
It is still a good idea to understand the logic behind the relationship, because sometimes there is this thing called autocorrelation, which we shouldn't dwell too much here. (If you insist on an explanation, check this out, a simple illustration).
to be continued...
Langganan:
Postingan (Atom)