This is part 2 of
Analyze
We have talked about a nifty tool where we can compare two continuous factors and find out if there is any relationship between them.
Now what about we are faced with two sets of data from two categories, such as male and female? This is when we can use the next tool.
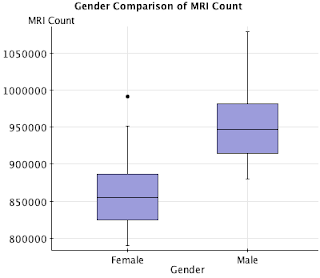
b. Box plots: Here are a sample of Box Plots - comparison of MRI count (an indicator of brain size) between male and female
As you can see, it is easy to note that Male has higher MRI count than female. To find out more about how to create Boxplots, click
here.
Now that we have all these tools, what next? The next steps is to have an open mind. Train your mind to
think creatively through getting rid of any prejudgment and objectively look at the facts separately from the language (e.g. an animal with long ears is not necessarily a rabbit, so if it eats meat, don't think it's a rabid rabbit), and separately from the past (e.g. a wireless communication device is sci-fi material in the 60s, but it does not mean it is not possible now). In conjunction to this, we need look for more potential influencing factors than what we normally pick. For example, if we want to improve our financial health, make sure we look beyond getting a pay raise or cutting back Starbucks coffee. There are plenty of other factors we need to look into.
Finally, as in almost anything in life, getting many flying hours is the key to getting a good grip of problem analysis. So, the only advice I have is, do it, practice, repeat.
Good luck.


Tidak ada komentar:
Posting Komentar